The average seller in England and Wales who sold in 2022 having bought within the last 20 years made a record gross profit of £108,000, up from £96,220 in 2021, new figures show.
There are now 173 local authorities in England & Wales where the average homeowner made a six-figure gain when selling their home – 87% of which are in the South of England.
Slower house price growth in London over the last few years has meant that in percentage terms, Welsh sellers are now making bigger gains than Londoners (59% versus 57% in 2022), according to the figures provided by Hamptons, based on Land Registry data.
The uplift in seller profit has been driven by more households selling larger homes. Typically, these have been owned for longer.
Chart 1 – Average seller gross profit across England & Wales
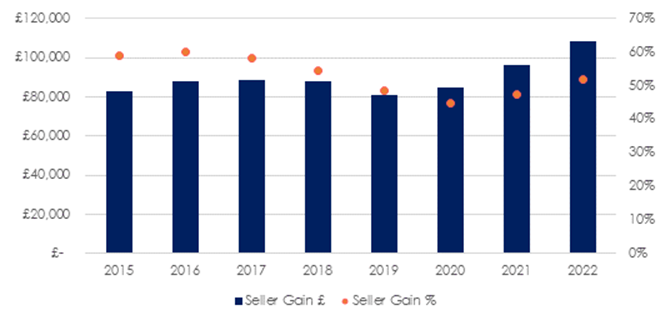
Source: Land Registry & Hamptons
Double-digit house price growth in 2022 has meant that homeowners cashing in have made record gains. The average seller in England and Wales who bought a property within the last 20 years and sold in 2022 made a gross profit of £108,000, up from £96,220 in 2021 (chart 1, table 1).
A record 94% of sellers sold their property in 2022 for more than they paid for it, having owned for an average of 8.9 years. In percentage terms, the average seller in England & Wales sold their home for 52% more than they bought it for (table 1).
Chart 2 – % difference between purchase and sale price by region
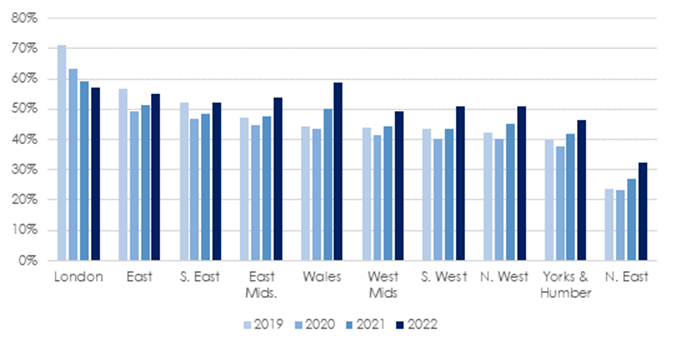
Source: Land Registry & Hamptons
There are now 173 (or 52%) local authorities across England & Wales where the average homeowner made a six-figure gain when selling their home. This figure has risen from 116 in 2021. 87% of these local authorities were located in the South of England, down from 94% in 2021.
London is the only region where the average household gain exceeded £100k in every Local Authority during 2022. In fact, there were 17 Boroughs where seller gains exceeded £200k. Across the capital, the average seller sold their home in 2022 for £219,110 or 57% more than they bought it for, having owned it for an average of 9.3 years (chart 2, table 1).
In financial terms, sellers in Kensington & Chelsea saw the biggest gains, with the average household selling their home for £684,510 more than they paid for it 10.4 years ago (table 2). Elmbridge is the only non-London local authority that sits within the top 10. Here, the average seller sold their home for £298,500 more than they paid for it, putting it in fifth place (table 2).
At the other end of the scale, the North East with an average gain of £37,890, had no local authorities with average gains above £100k. Sluggish house price growth in the region since the last financial crash has meant that 14% of sellers made a loss on their home in 2022. However, this figure has fallen from 31% recorded in 2019. Middlesbrough came bottom of the local authority list with an average seller gain of £23,640 in 2022.
Slower house price growth in London over the last few years has meant that, for the first time in at least five years, Welsh sellers are now making bigger gains than Londoners in percentage terms (chart 2, table 1). In 2022, the average home in Wales sold for 59% more than its purchase price, surpassing the London average of 57%. This also reflects the housing market cycle, with Wales having seen stronger price growth in recent years, partly due to its slow recovery from the 2008 financial crash.
Chart 3 – Seller gross profit across England & Wales by property type
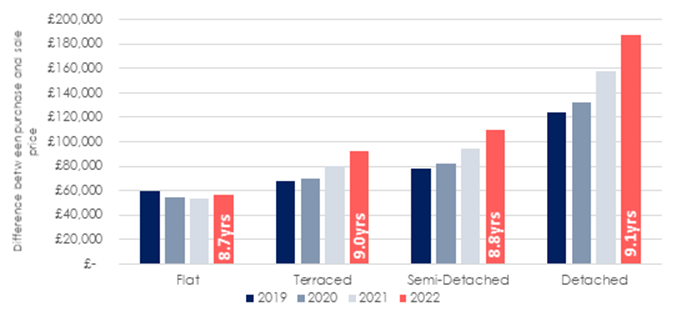
Source: Land Registry & Hamptons
The uplift in the average amount of money people have made on their property has been driven by more larger homes being sold in 2022. While detached homes made up 19% of sales in 2022, they accounted for 35% of properties selling for six figure gains in 2022. The average detached home was sold for £186,940 (or 61%) more than its original purchase price, 3.3 times the average gain made on a flat (£57,080) in 2022 (chart 3).
While the percentage gain made by house sellers increased between 2021 and 2022, weaker house price growth meant that it stayed the same for flat sellers. The average house seller in 2022 made a 57% gain on their home up from 51% in 2021, compared to 29% for flat owners in both 2022 and 2021.
Typically, these larger homes have also been owned for longer and have therefore benefited from additional house price inflation, boosting the average gain. Nearly a quarter (24%) of homes sold in 2022 had been bought 15-20 years ago, up from one in five (20%) in 2019.
Historically, flat owners have sold up sooner than house owners. However, the weaker flat market has meant that more flat owners have had to stay put for longer. Those who have owned a flat for longer and have built up more equity have been most able to afford to trade up. Of all the flats sold in 2022, just 34% had been bought within the last five years, down from 41% in 2020. As such, the average flat owner who sold in 2022 bought their home 8.7yrs ago, up from 8.3yrs in 2021, 2020 and 2019.
Aneisha Beveridge, head of research at Hamptons, said: “Soaring house price growth has boosted the money homeowners have made when they sell. House price gains are primarily driven by two factors – the length of time people have owned and the point at which they bought and sold in the house price cycle. 2022’s record breaking gains were boosted by Covid-induced changes, with a rising share of sales coming from larger family homes that were typically bought before the financial crisis. However, most of these profits are never seen by sellers as they are reinvested back into the housing market when they make their next purchase which has also increased in value.
“But house price growth hasn’t been distributed equally. Flat owners, in particular, have seen weaker price growth and are nearly four times as likely to sell at a loss compared to someone selling a house. Typically, these are first-time buyers and second steppers who have bought in the last five years and have accrued less equity in their homes. This, combined with higher mortgage rates, has limited their ability to cash in and trade up in 2022.
“While there are a number of uncertainties weighing on the market, even if prices do fall this year, it’s likely that over 90% of sellers will still sell at a profit. The other 10% will mostly be flat owners who bought in the last five or so years. The shift away from recent mortgaged homeowners selling cheaper homes towards older, more affluent homeowners selling more expensive homes also looks set to push up gains among sellers again this year.”
Table 1 – 2022 seller gains by region
| Region | £ difference between sale & purchase price | % difference between sale & purchase price | Average years of ownership |
| London | £ 219,110 | 57% | 9.3 |
| South East | £ 141,760 | 52% | 8.9 |
| East of England | £ 123,200 | 55% | 8.6 |
| South West | £ 112,610 | 51% | 8.3 |
| East Midlands | £ 81,510 | 54% | 8.7 |
| West Midlands | £ 80,570 | 49% | 8.6 |
| Wales | £ 74,660 | 59% | 8.9 |
| North West | £ 67,500 | 51% | 8.9 |
| Yorkshire & the Humber | £ 63,380 | 46% | 9.0 |
| North East | £ 37,890 | 32% | 8.2 |
| England & Wales | £ 108,000 | 52% | 8.9 |
Source: Land Registry & Hamptons
Table 2 – Top 3 local authorities in each region with the biggest 2022 seller £ gains
| Region | Local Authority | Average seller gain £ | Average seller gain % | Average length of ownership |
| London | KENSINGTON AND CHELSEA | £ 684,510 | 60% | 10.4 |
| CITY OF WESTMINSTER | £ 473,180 | 55% | 10.2 | |
| RICHMOND UPON THAMES | £ 319,350 | 55% | 9.2 | |
| South East | ELMBRIDGE | £ 298,500 | 56% | 9.3 |
| WAVERLEY | £ 214,940 | 53% | 9.1 | |
| EPSOM AND EWELL | £ 205,750 | 56% | 9.6 | |
| East | THREE RIVERS | £ 243,510 | 67% | 10.3 |
| ST ALBANS | £ 237,550 | 60% | 9.1 | |
| HERTSMERE | £ 208,330 | 58% | 9.3 | |
| South West | COTSWOLD | £ 167,960 | 56% | 8.6 |
| SOUTH HAMS | £ 162,840 | 54% | 8.3 | |
| BATH & NORTH EAST SOMERSET | £ 158,010 | 52% | 8.4 | |
| Wales | MONMOUTHSHIRE | £ 117,560 | 61% | 9.1 |
| THE VALE OF GLAMORGAN | £ 112,100 | 61% | 8.9 | |
| ISLE OF ANGLESEY | £ 100,690 | 69% | 9.1 | |
| West Midlands | SOLIHULL | £ 122,410 | 49% | 8.9 |
| BROMSGROVE | £ 119,840 | 51% | 8.4 | |
| STRATFORD-ON-AVON | £ 115,950 | 42% | 8.2 | |
| East Midlands | RUSHCLIFFE | £ 120,750 | 53% | 8.1 |
| RUTLAND | £ 113,470 | 56% | 8.9 | |
| DERBYSHIRE DALES | £ 113,280 | 52% | 9.0 | |
| Yorkshire & The Humber | HARROGATE | £ 121,260 | 44% | 8.3 |
| RYEDALE | £ 108,100 | 50% | 8.4 | |
| YORK | £ 102,780 | 50% | 8.5 | |
| North East | NORTH TYNESIDE | £ 58,190 | 41% | 9.1 |
| NORTHUMBERLAND | £ 56,530 | 37% | 8.9 | |
| NEWCASTLE UPON TYNE | £ 51,600 | 32% | 9.0 | |
| North West | TRAFFORD | £ 169,680 | 73% | 8.8 |
| STOCKPORT | £ 113,800 | 67% | 8.6 | |
| SOUTH LAKELAND | £ 104,340 | 50% | 9.3 |
Source: www.propertyindustryeye.com